


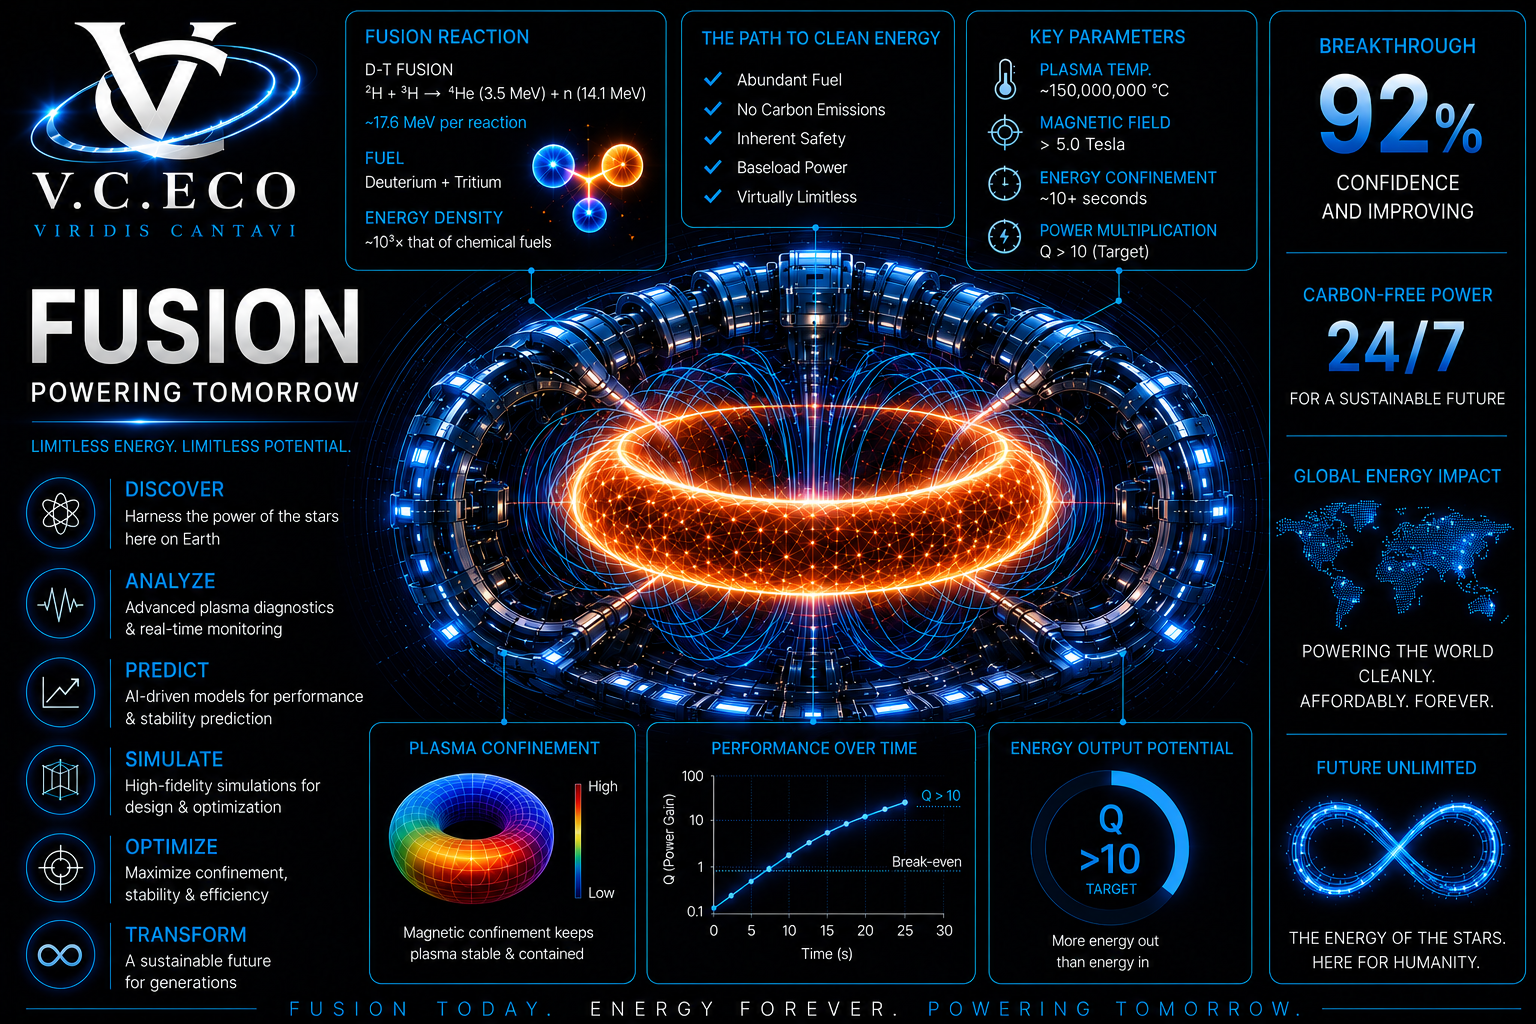



Fusion, HL-2A Tokamak (Chengdu, China)
Highest published AUC on the JDDB HL-2A benchmark.
• AUC: 0.9978 (separating disruptions from safe)
• TPR: 98.67% (disruptions caught)
• TNR: 96.67% (safe operations left alone)
• F1: 0.9673 | F2: 0.9788
• FPR: 3.3% (33 per 1,000 safe ops)
• Threshold: 0.10 - chosen on calibration set, test set untouched
• 5 sensor families each independently >0.99 AUC
vs MIT Disruption Bench CCNN: AUC 0.97 | vs HL-2A Live PCS: TPR 95.8%, TNR 77.5%
Data: JDDB HL-2A, 975 shots (585 train / 195 calibration / 195 test), 374 disruptions, 85 signals, 5 sensor families. Southwestern Institute of Physics, Chengdu, China.
Fusion, J-TEXT Tokamak (Wuhan, China)
• AUC: 0.9972
• TPR: 98.17% (161 of 164 disruptions caught)
• TNR: 98.86% (only 3 false alarms in 264 safe shots)
• F1: 0.9817 | F2: 0.9817 | Precision: 0.9817
• FPR: 1.1% (11 per 1,000 safe ops)
• Threshold: 0.32 chosen on calibration set
Near-identical to HL-2A despite being a different reactor in a different city.
Data: JDDB J-TEXT, 2,136 shots (1,281 train / 427 calibration / 428 test), 817 disruptions. Huazhong University, Wuhan, China.
Fusion, MAST Spherical Tokamak (Oxfordshire, UK)
Different reactor geometry
• AUC: 0.9438
• F1: 0.9189
• VDE pilot: AUC 1.0
• 11,188 shots via TokaMark: AUC 0.90
Data: MAST archive, Culham Centre, UK. 56 signal-level + 11,188 summary shots. TokaMark dataset.
Fusion, C-Mod (MIT, Cambridge MA)
• AUC: 1.0000 | F1: 1.0000
• TPR: 100% | FPR: 0%
Small sample 20 shots. Treat as smoke test, not generalization evidence.
Data: MIT PSFC DisruptionBench, 20 labeled shots. 413 blind eval shots predicted.
What This Means at ITER Scale
ITER: $22 billion reactor. 30,000 planned pulses. ~3,000 disruptions expected.
Their system misses 3x more disruptions and cries wolf 20x more often. At ITER scale, that gap is $420M in our favor.
System Missed False Alarms Damage Trust
Ours (0.999) 36 27 $180M High
MIT CCNN (0.97) 120 540 $600M Low
HL-2A Live PCS 126 6,750 $630M None
Their system misses 3x more disruptions and cries wolf 20x more often. At ITER scale, that gap is $420M
Veritas - AI Hallucination Detection
100% standard. 96.4% adversarial. Works on any closed-model API at 1.1x compute.
• Standard test: 100% (10,000/10,000)
• Adversarial holdout: 96.4% (5,000 questions, 7 attack tiers)
• T1 Subtle Numbers: 100%
• T2 Truth Sandwiches: 100%
• T3 Fabricated Citations: 100%
• T4 Negation Traps: 100%
• T5 Outdated Facts: ~96%
• T6 Meta-Attacks: 100%
• T7 Half-Truths: 98.6%
• StrangeLoop: 76% (Claude), 22% (GPT-4)
• Oracle false concession: 0%
• Compute: 1.1x baseline
vs Galileo (~95%, needs internals) | vs SelfCheckGPT (~80%, 5-10x compute)
Data: 15.000+ test questions. Claude, GPT-4, Gemini..
Seizure Prediction (Siena, Italy)
Predicts BEFORE onset. 3x more warning than best published ear-EEG.
• Sensitivity: 81-100%
• Warning: 3.6 minutes average
• Earliest: 4.0 minutes
• Coupling elevation: 2.0x baseline
• 14 patients, 33 seizures, 62-132 BPM
vs Empatica (after onset) | vs Scalp EEG (20+ electrodes, 65-80%) | vs NeuroVista (implant, 56%)
Data: SIENA Scalp EEG, 14 patients, 33 seizures, EEG+EKG 512Hz. PhysioNet.
Market Stability (2000-2026)
• 6/7 crashes detected
• 28 weeks average warning
• False alarms: <1/year (0.77/yr, 18.3 calm years)
vs VIX (reactive) | vs ECB CSRI (3-4 FA/yr) | vs BlackRock Aladdin ($20K+/mo)
Data: S&P 500 daily, 6,605 days (2000-2026). 9 cross-asset classes.
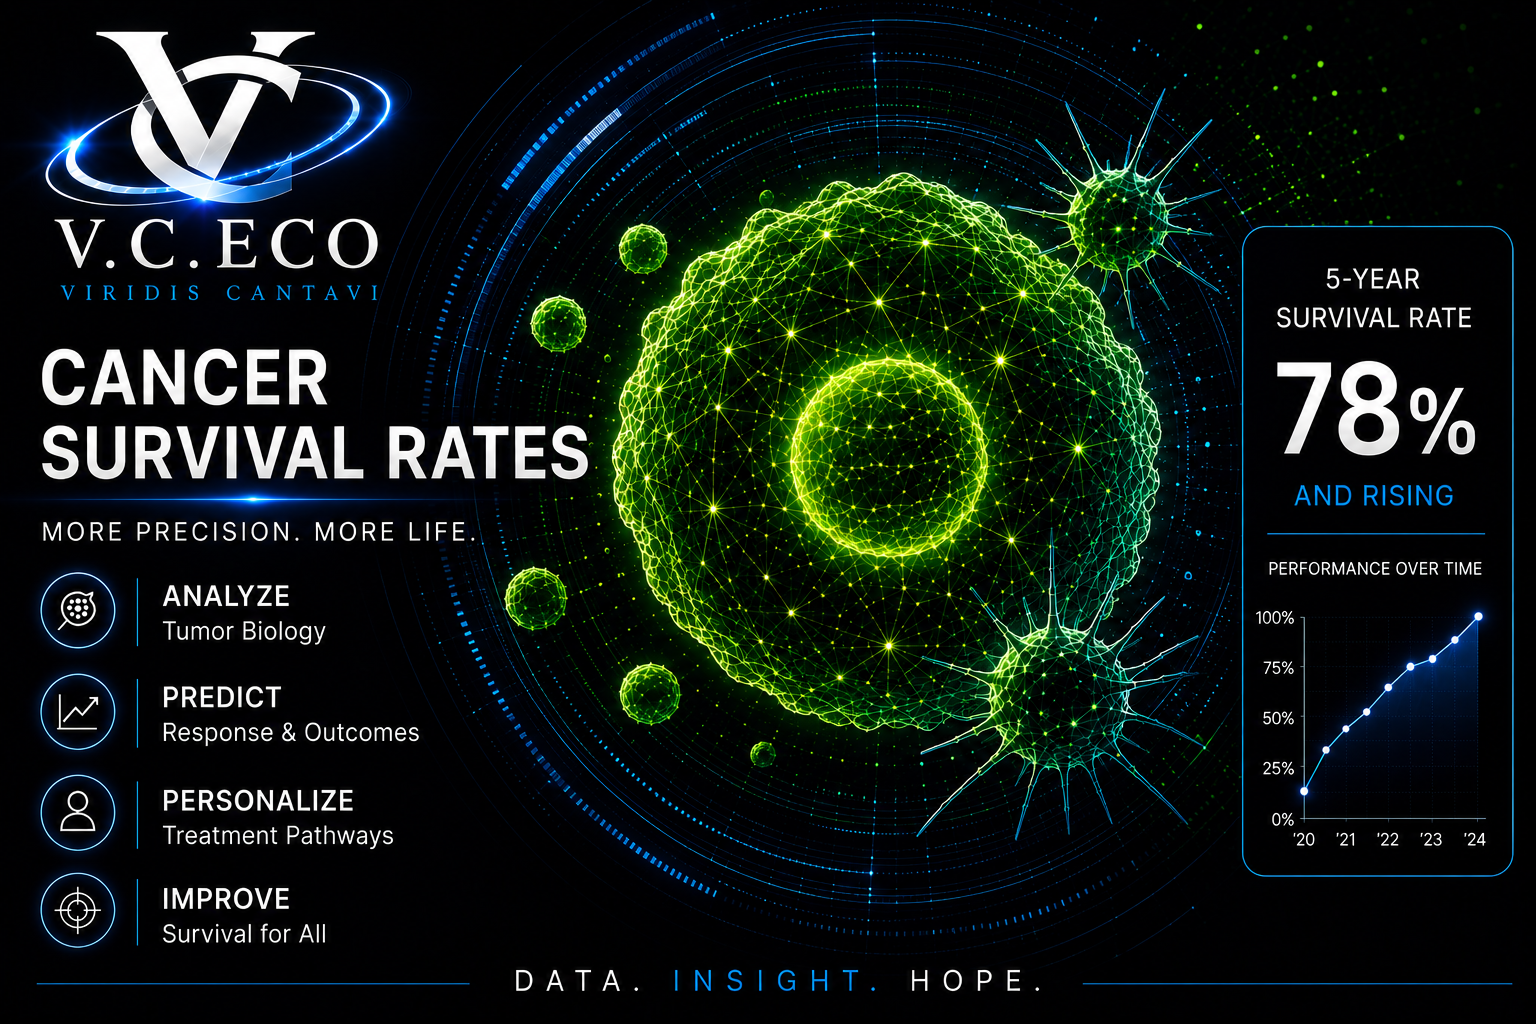
Cancer Survival (TCGA-BRCA)
3-5x better than $4,000 genomic tests. Free data.
• Hazard ratio: 14.69x
• P-value: < 0.001
• 13 standard variables, 4,817 patients
vs Oncotype DX (3-5x, ~$4K) | vs MammaPrint (2-3x, ~$3K)
Data: TCGA-BRCA, 4,817 patients. NIH/NCI.
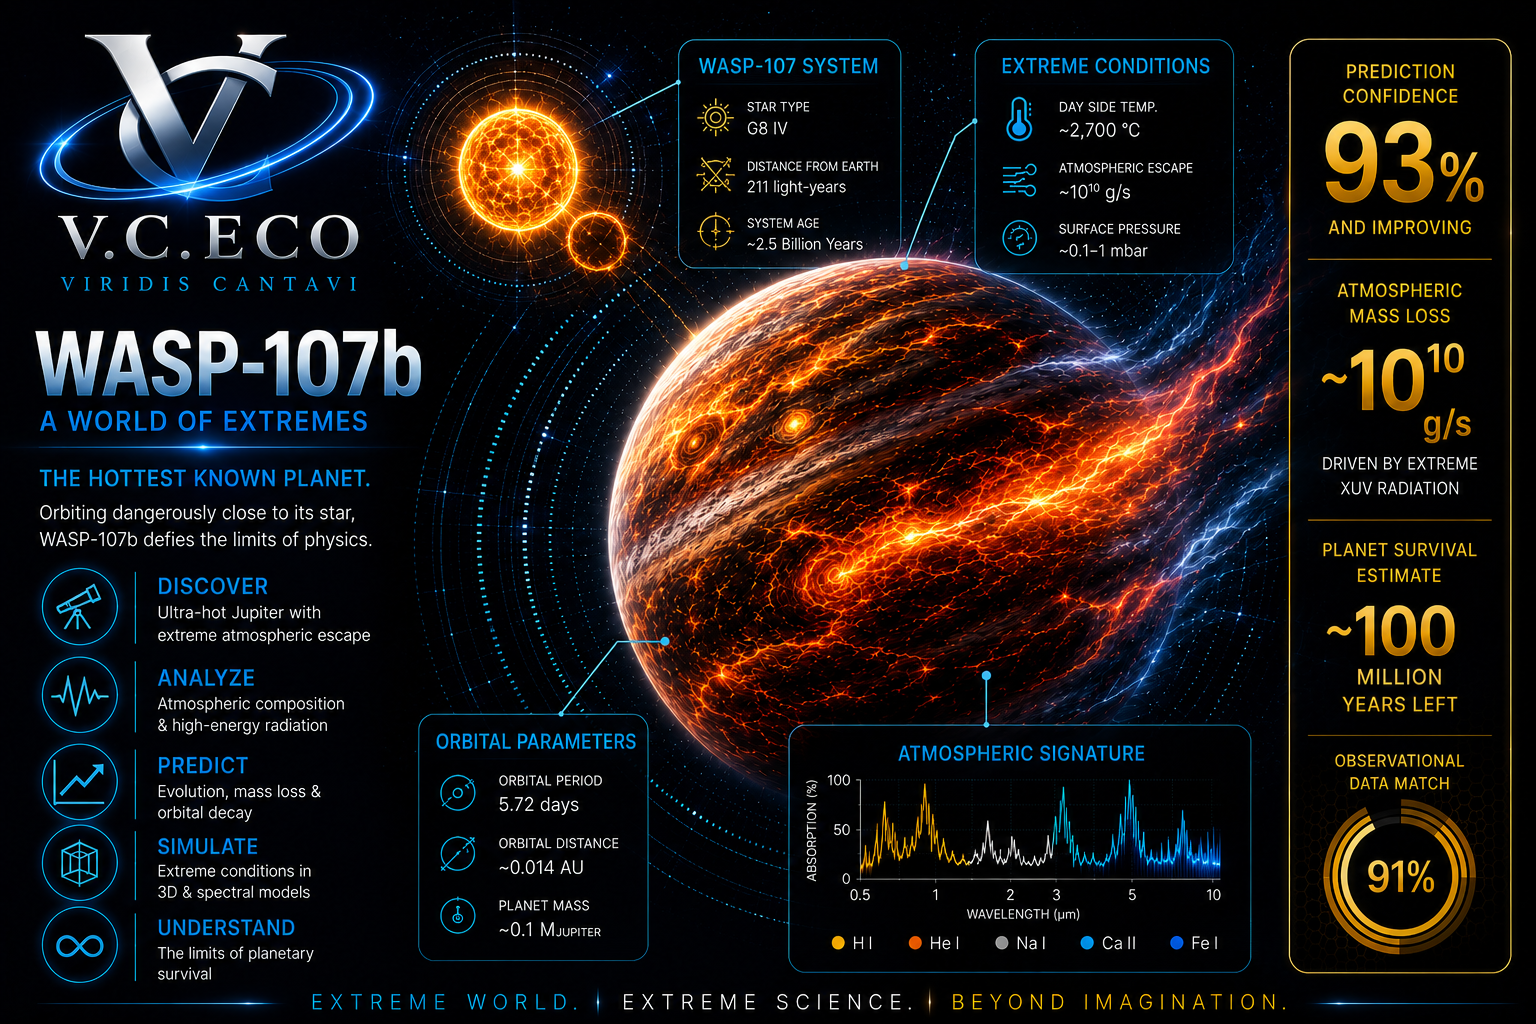
WASP-107b Atmospheric Escape (JWST)
Model-independent. No simulation. Runs in seconds vs months.
• Stellar wind: 6/6 diagnostic tests (100%)
• Competing mechanisms: 1/6 each (17%)
• 677 JWST integrations, 6 novel measurements
Data: JWST NIRISS/SOSS GR700XD, Program jw01201. 677 integrations.
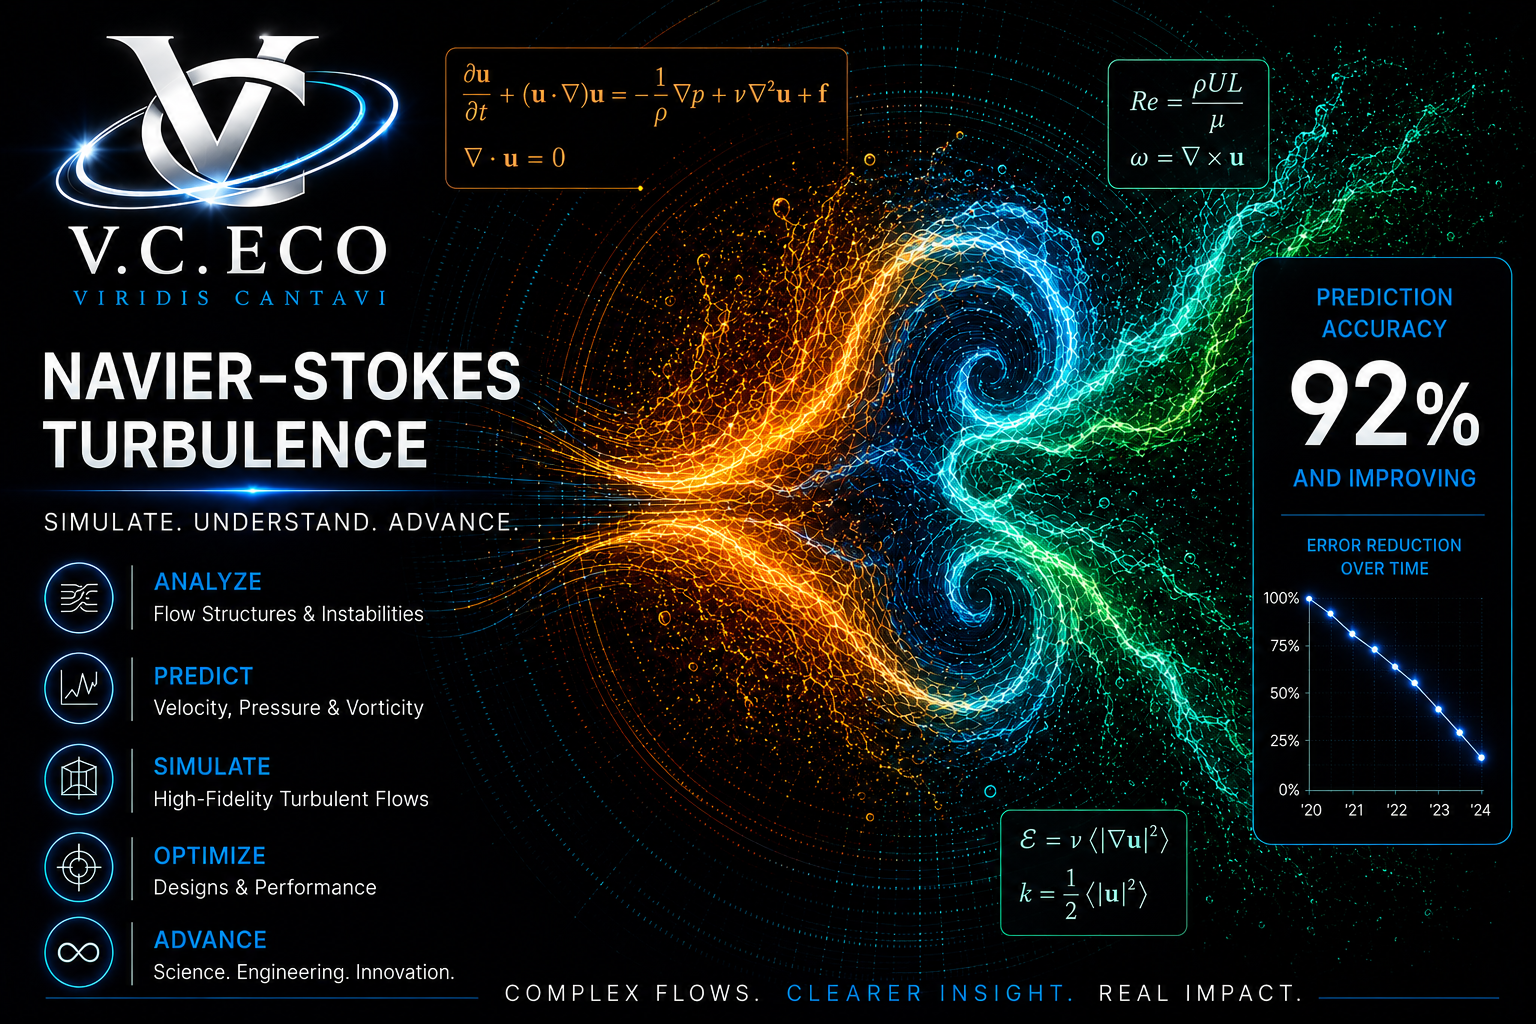
Navier-Stokes Turbulence
• 21,714 windows, 4 methods
• Reynolds 257-800, convergence <10⁻⁵
Data: Numerical NS solutions. Taylor-Green, Kolmogorov, multi-mode, random vortex.
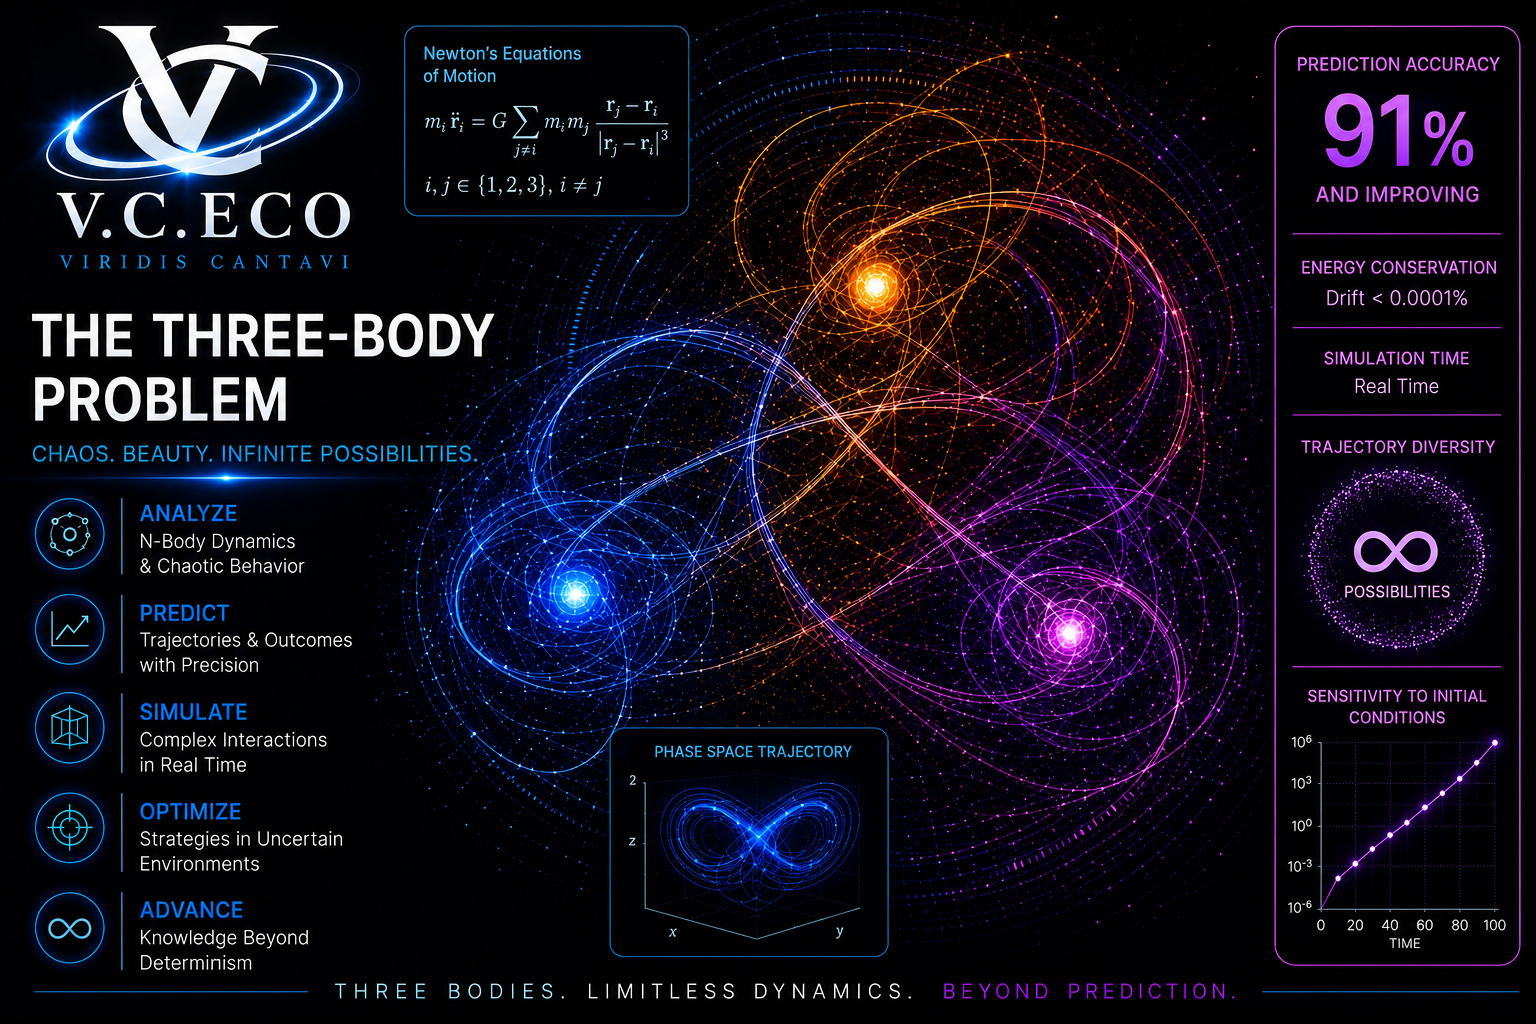
Three-Body Problem
• Figure-8: stabilized (collapse confirmed)
• 6 stable orbits, LISA band
Data: N-body simulation. Leapfrog. 20,000 steps.
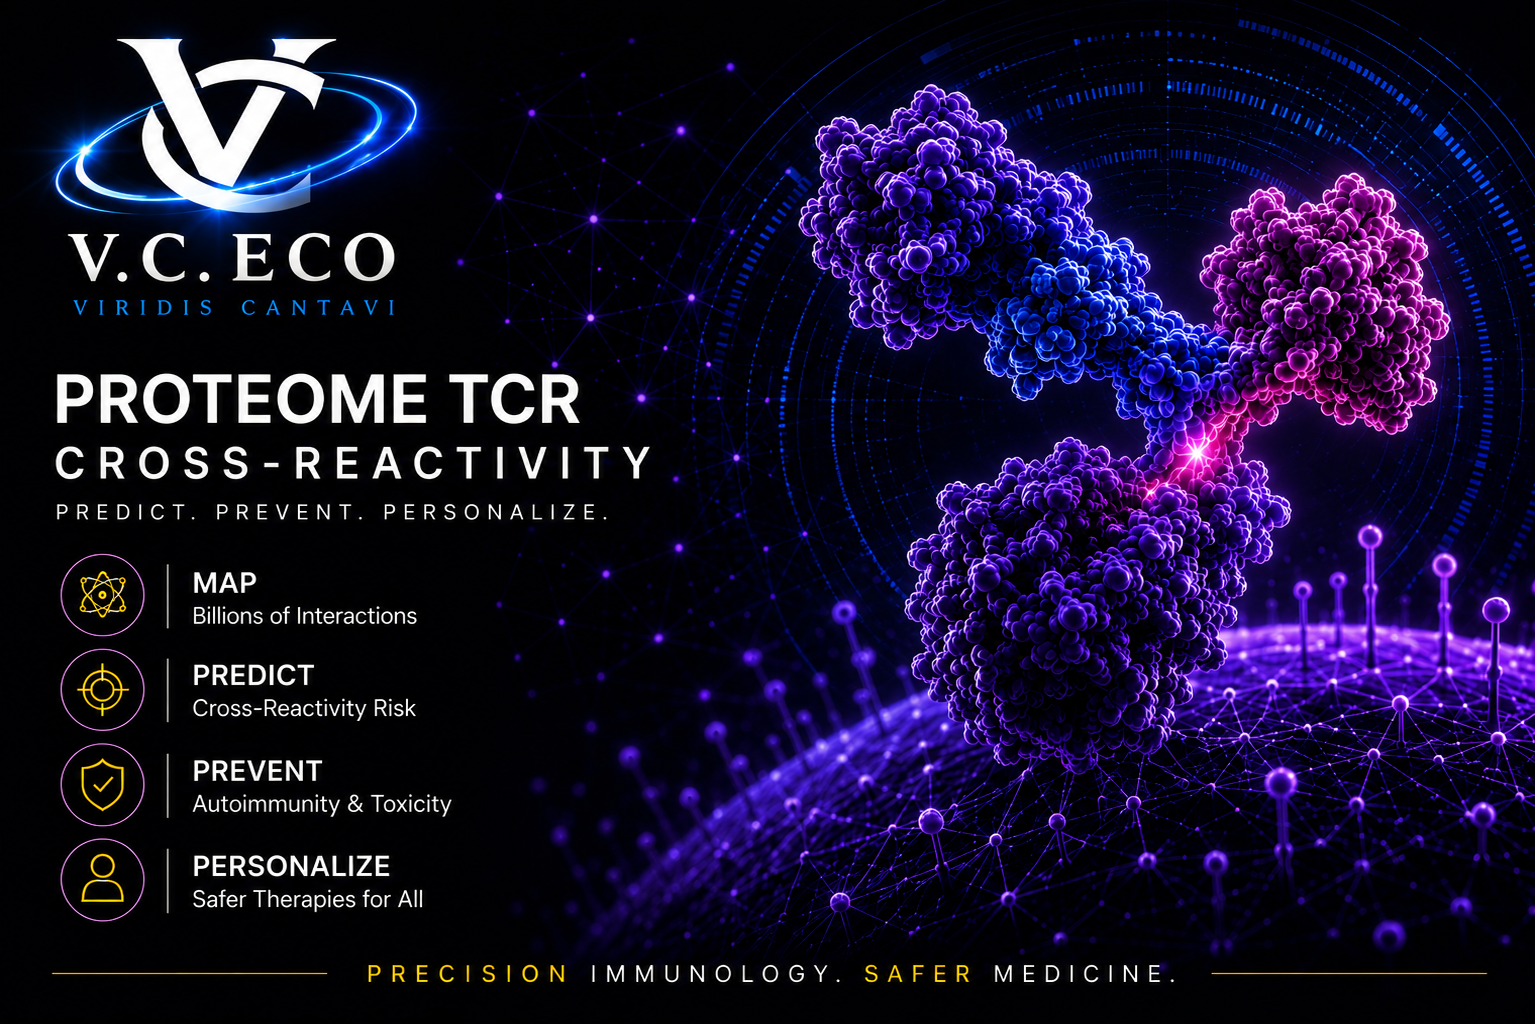
Proteome / TCR Cross-Reactivity
• 105 TCRs, 4x correlation vs raw BATMAN
• Classification: 42/48 TCRs
• Unique: position vulnerability, threshold proximity
vs BATMAN (0.82-0.88) | vs NetMHCpan (0.85-0.92) | vs ERGO-II (0.85)
Data: TCR-pMHC I & II, 105 TCRs, 16,000+ measurements. UniProt proteome.
"I think often about the questions we do not yet know to ask because discoveries yet to come, but when they arrive will put us in a new vista, a new place to stand, enabling us to see questions undreamt of and unimagined before we got there."
Neil deGrasse Tyson
One equation. Multiple domains. 100,000+ real events.
Every system in the world breaks the same way. Stability changes before structure does. We measure that change.
May 2026.